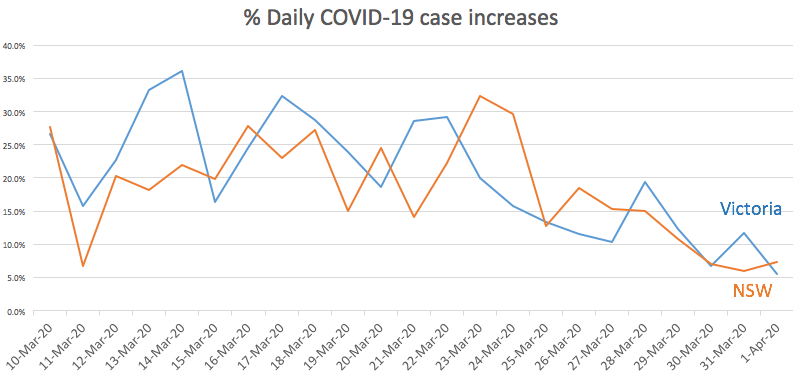

Victoria and the rest of Australia are essentially only a few steps away from full lockdown mode and the earlier restrictions are bearing fruit: we’re down to 5% daily increase! And NSW is in the same league with 7.4%.
This should enable us to effectively locally eradicate COVID-19 soon especially given the fact we can’t have seen the benefits yet of the really severe distancing imposed recently. Unless the higher level of community transmission in Victoria (cases without known cause) comes back to bite us.
Why are we interested in seeing a drop in % increases?
In a non-near-saturated outbreak, reducing per-cent increases over time is the simplest (approximate) indicator of effects of social distancing. Without social distancing, exponential growth is mathematically equivalent to a constant % growth per day. It’s only approximate, because we should really be calculating the % of infectious cases. But until late in an outbreak, most of the cases are infectious so it’s not a bad marker.
People often quote the daily case count without mentioning the % increase. Obviously seeing the daily count go down is great (even better than the daily %). But a constant daily count is also a good sign as that means the % is going down.
So it’s not possible to determine from the count when social distancing is having zero effect.
So that’s why we focus on the % increase since when it drops we know the social distancing is getting better.
